16 Jul 2026
Mapping Digital Pathways: How Interaction Data Shapes Athletic Media Presentation on Websites

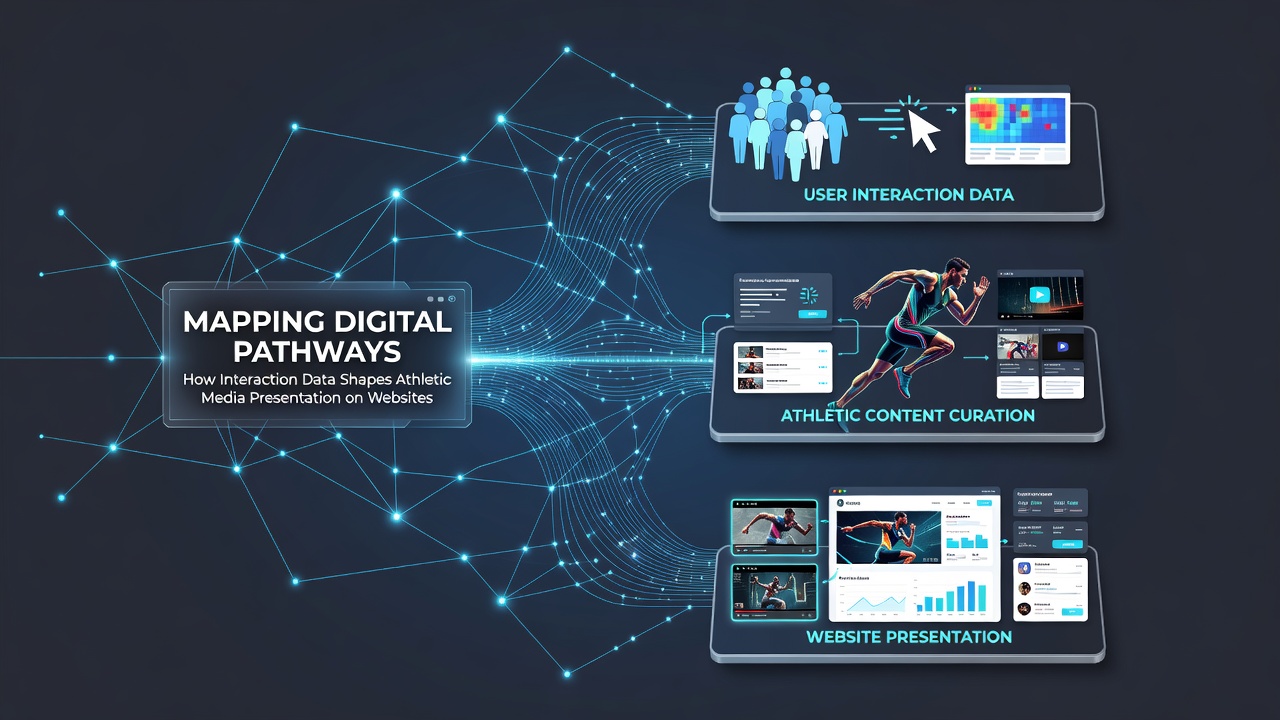
Interaction data from website visitors creates detailed maps of how people move through athletic content platforms, and these maps directly influence the order and visibility of videos, images, and related materials presented to subsequent users. Researchers track clicks, dwell times, and navigation sequences to identify patterns that determine which athletic media items rise to prominent positions on homepages or category listings. Data collection occurs through standard analytics tools that record sequences without storing personal identifiers in most implementations.
Tracing Visitor Routes Through Athletic Sites
Digital pathways emerge when users enter a sports media site through search engines, direct links, or social referrals, and their subsequent clicks form trails that platforms analyze in aggregate. Observers note that entry points often lead to specific video highlights or photo collections, after which users either continue to related reviews or exit the session. In July 2026 platforms began incorporating seasonal event data, such as post-Olympic interest spikes, into these pathway calculations to adjust media rotation schedules accordingly.
Those who study user behavior report that common routes include transitions from league standings pages to embedded match clips, while others move from athlete profile sections directly to gallery views. These sequences get logged and clustered by similarity, allowing site operators to identify high-traffic corridors and reinforce them with additional relevant material. The process relies on session recordings rather than individual profiles, which keeps the focus on collective movement patterns.
Data Layers and Media Arrangement Decisions
Multiple data layers combine to shape presentation choices, starting with raw clickstream information that shows which media elements receive the most sustained attention. Additional inputs come from scroll depth measurements and exit points, which indicate where users lose interest in a particular video sequence or image set. Platforms process these layers through established sorting algorithms that prioritize items appearing at the end of frequent pathways.
According to research published by the University of Queensland Centre for Digital Media Studies, athletic websites that map pathways achieve more consistent placement of popular clips near navigation hubs. The study examined traffic logs from several regional sports portals and found measurable shifts in media order within days of pattern updates. External references such as those provided by the Australian Sports Commission further illustrate how aggregated navigation statistics support decisions about thumbnail sizing and autoplay settings for highlights.
Integration With Existing Site Structures
Existing navigation menus and search functions serve as fixed channels that direct interaction data into usable formats for media curation. When users follow menu paths from a main sports hub to subcategories like team news or event recaps, those movements contribute to weighted scores assigned to associated videos and photographs. Search bar activity adds another dimension, because query terms that precede media views help platforms surface similar items in future sessions.
Those who manage athletic platforms report that pathway data updates occur on weekly cycles in most cases, although major tournaments trigger more frequent recalibrations. The adjustments appear in the form of reordered carousels, revised sidebar recommendations, and altered loading sequences for image galleries. Because the underlying information remains aggregated, individual user identities stay protected while still informing broad presentation strategies.
Examples From Operational Platforms
One documented case involves a European football portal that adjusted its video playlist order after pathway analysis revealed repeated movement from match schedules to post-game interviews. The change resulted in interview segments appearing earlier in user flows, which aligned with observed navigation habits. Another instance from a North American league site showed image galleries receiving increased prominence once data indicated that visitors often branched from statistical tables directly to photo archives.
These adjustments follow established procedures rather than ad-hoc decisions, and they draw on historical logs spanning multiple seasons. Observers note that the same datasets also support testing of new layout variations, where A/B comparisons measure how different media arrangements affect continuation rates along established pathways.
Conclusion
Mapping digital pathways through interaction data provides athletic media platforms with structured methods for arranging videos, images, and supporting materials based on collective user movement. The resulting presentation reflects aggregated navigation patterns rather than individual preferences, and updates continue on regular schedules informed by ongoing data collection. As of July 2026 these practices remain central to how sports content sites organize and refresh their media offerings across different regions and event cycles.